


FIRST-HALF 2025 VS FIRST-HALF 2026 DANVILLE DETACHED HOMES
The Headline Held. The Value Slipped.
Preview PDF
Two stories can be true at the same time. Danville's median sale price rose 1.2 percent in the first half of 2026, from $2,183,750 to $2,210,000. That is the number most reports would lead with, and in many cases, the number they would stop at.
I would not stop there. Price per square foot, the cleaner read on underlying value, fell 4.7 percent, from $825 to $787. The headline said the market held. The value gauge said it softened. That is the story homeowners need to understand before they price, prep, negotiate, or decide to wait.
Median sale price +1.2% ($2,183,750 to $2,210,000). Median price per sq. ft. -4.7% ($825 to $787).
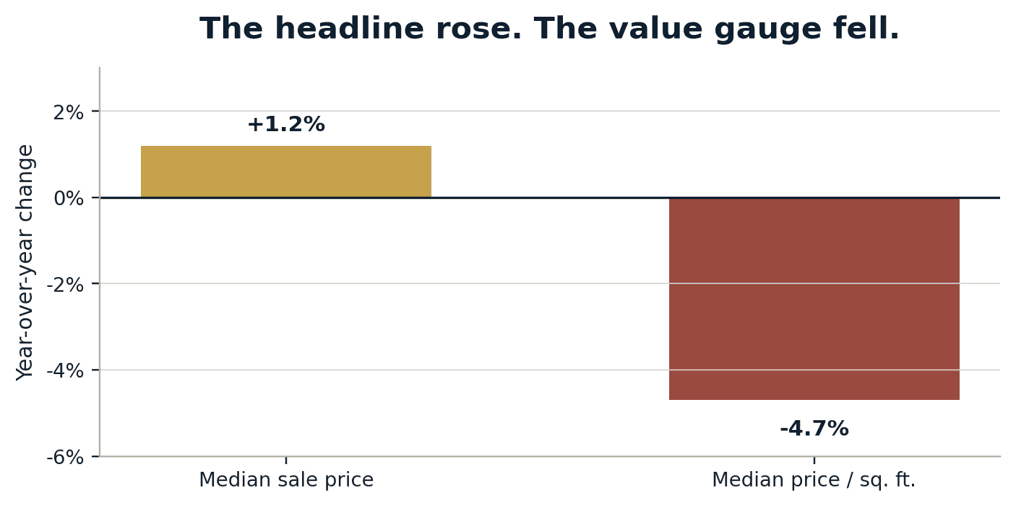
Why they disagree: median price just finds the middle sale. Price per foot corrects for the mix of homes that happened to trade. When they point in opposite directions, the per-foot number is the more honest read of value.
CORE PRICING
What a Danville Home Looked Like, Then and Now
Measure | H1 2025 | H1 2026 | Change |
Closed sales | 225 | 231 | +2.7% |
Median sale price | $2,183,750 | $2,210,000 | +1.2% |
Average sale price | $2,341,795 | $2,344,748 | +0.1% |
Median price / sq. ft. | $825 | $787 | -4.7% |
Median home size | 2,697 sf | 2,670 sf | -1.0% |
Median lot size | 10,411 sf | 11,700 sf | +12.4% |
Homes barely changed in size, so the price-per-foot decline is not a case of smaller houses dragging the number down. Values genuinely eased. Larger lots trading hands helped prop up the flat median, which is exactly why the headline alone can mislead.
A TALE OF TWO DANVILLES
The Premium Pocket Held. The Broader Market Gave a Little Back.
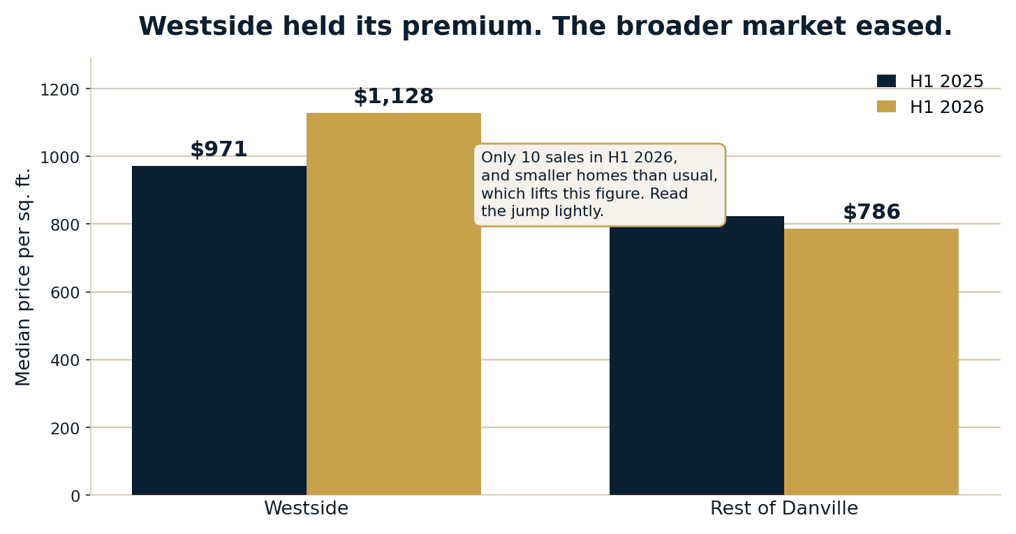
Westside Danville remained Danville's premium pocket. The rest of Danville stayed flat on median price and eased by about 5 percent per foot. The exact size of Westside's jump should be read lightly because only 10 Westside homes sold in the first half of 2026 and they ran smaller than usual, which lifts the per-foot figure. But the direction is clear: the best pocket held while the broader market softened.
Segment | Sales | Median price | Price / sf |
Westside Danville 2025 | 19 | $2,499,000 | $971 |
Westside Danville 2026 | 10 | $2,747,500 | $1,128 |
Rest of Danville 2025 | 206 | $2,150,000 | $823 |
Rest of Danville 2026 | 221 | $2,150,000 | $786 |
WHERE THE VOLUME MOVED
The Move-Up Core Thinned.
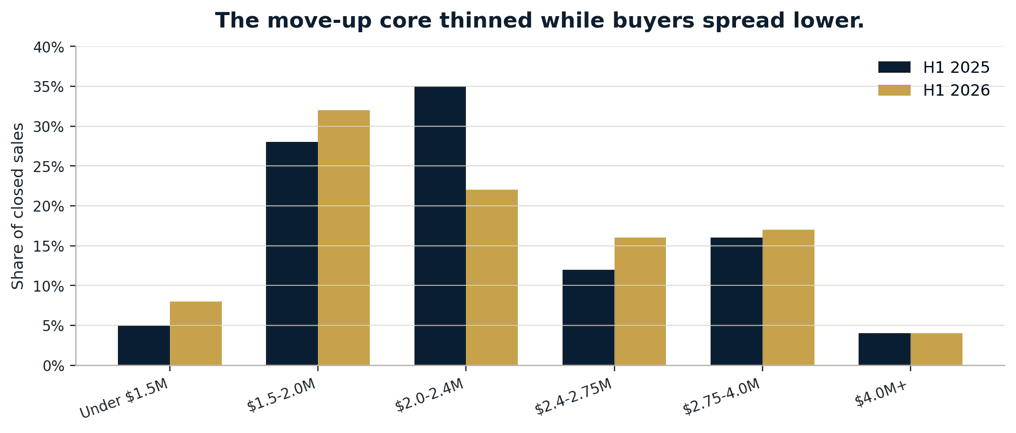
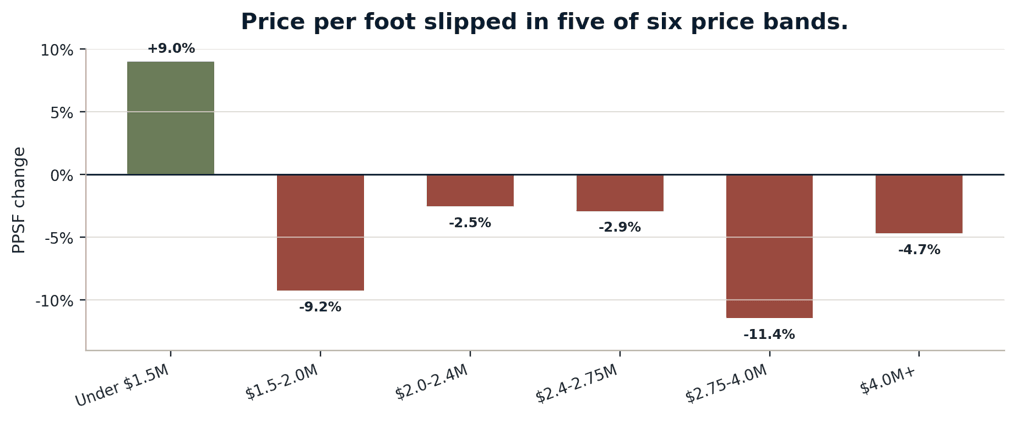
The $2.0M to $2.4M core, long the heart of the Danville move-up market, fell from 35 percent of all sales to 22 percent. Buyers did not disappear. They spread toward lower bands, while values per foot slipped in five of the six price brackets we tracked.
Price band | 2025 sales (share) | 2026 sales (share) | PPSF 2025 | PPSF 2026 |
Under $1.5M | 11 (5%) | 18 (8%) | $722 | $787 |
$1.5M to $2.0M | 63 (28%) | 75 (32%) | $866 | $786 |
$2.0M to $2.4M | 79 (35%) | 51 (22%) | $830 | $809 |
$2.4M to $2.75M | 27 (12%) | 38 (16%) | $791 | $768 |
$2.75M to $4.0M | 37 (16%) | 40 (17%) | $858 | $760 |
$4.0M and up | 8 (4%) | 9 (4%) | $899 | $857 |
SPEED AND COMPETITION
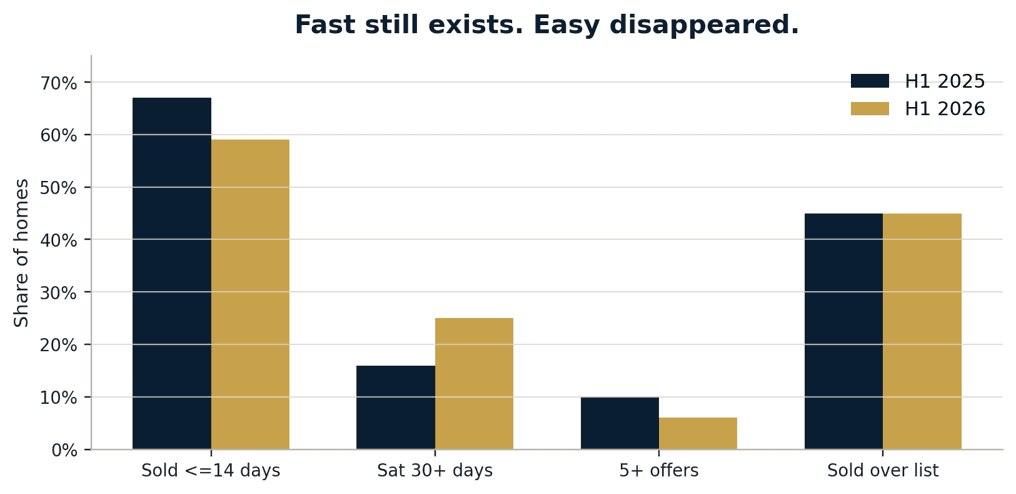
Fast Still Exists. Easy Disappeared.
The middle of the market still looked healthy. Median days on market moved only from 8 to 10 days, and the median sale-to-list ratio stayed at 100 percent. Nothing looks broken if you only look at the middle. The change lives in the spread.
Fewer homes sold inside two weeks. More homes sat 30 days or longer. Fewer listings drew five or more offers. Well-priced homes still moved. Mispriced homes lingered in a way they did not a year ago.
Measure | H1 2025 | H1 2026 |
Median days on market | 8 | 10 |
Sold in 14 days or less | 67% | 59% |
Sat 30 days or more | 16% | 25% |
Sold over list price | 45% | 45% |
Median sale-to-list | 100% | 100% |
Drew 5 or more offers | 10% | 6% |
Sold Over List Is Not Sold Over Value Forty-five percent of Danville homes sold over asking this year. It is the most quoted number in real estate, and often the least complete. A list price is chosen by the seller and the listing agent. Beating it proves the number was beatable, not that the home reached its full worth. In our first-half data, nearly one in three fast, over-asking sales still closed below what comparable homes were achieving. The sign said sold over asking. The comparables said money was left behind. |
CASH
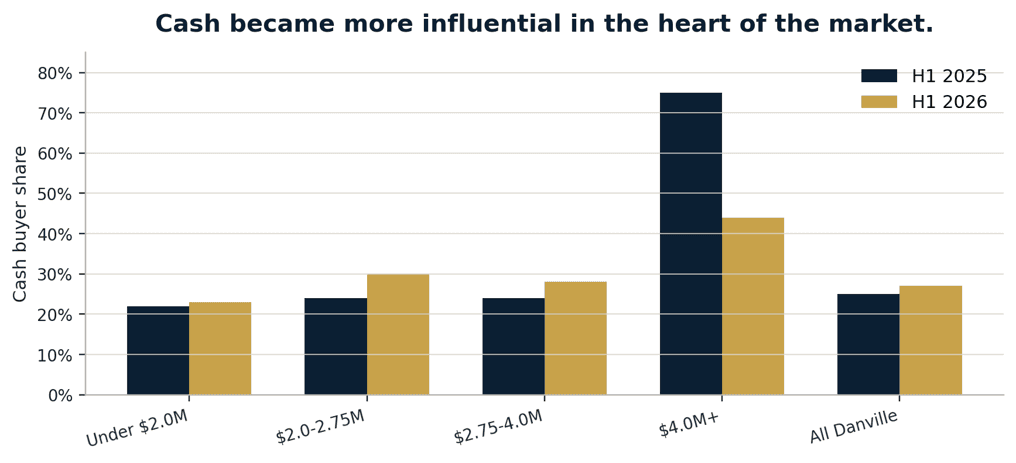
Cash Moved Up-Market.
Cash held roughly flat at the entry level but rose through the heart of the market. The $2.0M to $2.75M bracket climbed from 24 percent cash to 30 percent, and $2.75M to $4.0M rose from 24 percent to 28 percent. The very top is directional because the count is small, but the pattern fits the rate environment: as financing-dependent buyers thin out, cash buyers make up more of the pool. They rarely overpay per foot.
Price bracket | H1 2025 | H1 2026 |
Under $2.0M | 22% | 23% |
$2.0M to $2.75M | 24% | 30% |
$2.75M to $4.0M | 24% | 28% |
$4.0M and up † | 75% | 44% |
All Danville | 25% | 27% |
BY NEIGHBORHOOD
Neighborhoods Did Not Move Together.
Averages are useful for the environment. They are dangerous as a valuation shortcut. Blackhawk Country Club is the cleanest example: median sale price rose about 15 percent, yet price per foot fell about 8 percent because larger, pricier estates traded hands. The headline suggested appreciation. The per-foot data told the more disciplined story.
Neighborhood | Sales 25 / 26 | Median price | Price / sf |
Blackhawk C.C. | 38 / 31 | $2.27M → $2.62M | $808 → $743 |
Westside Danville † | 19 / 10 | $2.50M → $2.75M | $971 → $1,128 |
Greenbrook † | 11 / 10 | $2.00M → $1.94M | $882 → $866 |
Tassajara Ranch † | 8 / 9 | $2.04M → $1.96M | $821 → $745 |
Crow Canyon C.C. † | 8 / 6 | $1.67M → $1.77M | $824 → $824 |
|
|
|
|
† Fewer than a dozen sales in at least one period. Treat these as directional, not definitive. Small samples swing on a single unusual home.
TIMING WITHIN THE HALF
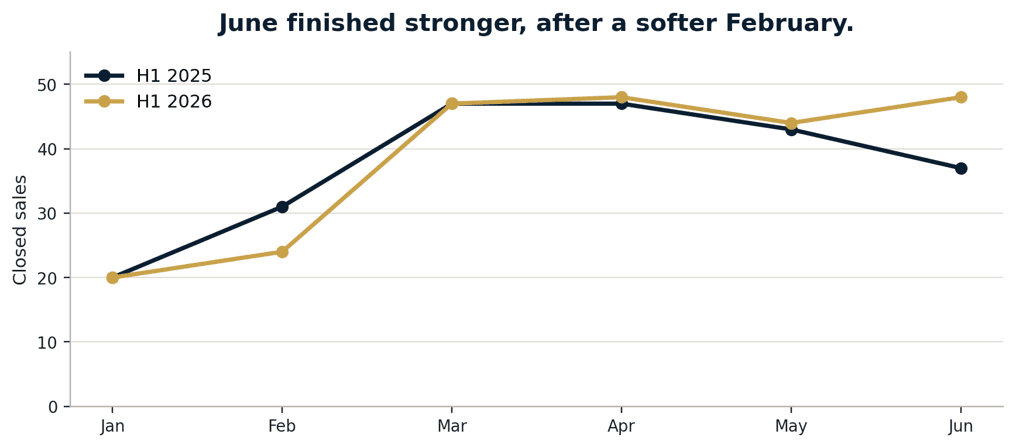
June Finished With Momentum Worth Watching.
2026 tracked the prior year almost month for month, with a slower February and a stronger June finish. June sales rose 30 percent over June 2025, closing the first half with momentum that matters heading into the second half of the year.
Month | 2025 | 2026 |
January | 20 | 20 |
February | 31 | 24 |
March | 47 | 47 |
April | 47 | 48 |
May | 43 | 44 |
June | 37 | 48 |
PRINCIPAL READ
My Take: This Is Not a Weak Market. It Is a Selective One.
The easy interpretation is to say Danville prices rose because the median sale price increased. The more honest interpretation is that the headline held while underlying value softened. That distinction matters because it tells sellers what kind of market they are really entering.
This market still rewards the right home. It still rewards preparation. It still rewards pricing discipline. But it is punishing the homes that miss the mark. The difference between launching strong and sitting stale is now measured in real dollars, not just days on market.
Your home is your fortune. Measure it against comparable results, not headlines. The difference can be worth hundreds of thousands of dollars.
SOURCES, METHODS AND DISCLOSURES
Data source: Bay East Association of REALTORS MLS, accessed via Paragon. All data for detached single-family homes in the City of Danville, sold January 1 to June 30 of each year. Compiled by Robert Song. Figures are current as of the pull date and may shift as late records post.
What we included and excluded: A small number of border-ZIP 94588 records were removed to keep the geography true to Danville. Off-market sales are counted in the pricing figures but excluded from days-on-market and competition statistics, since a home sold privately never openly competed. Diablo filters as a separate city in the MLS and is not included; Blackhawk is a Danville subdivision and is included.
Why price per square foot leads: Median price moves with the mix of homes that happen to sell. Price per square foot compares homes on more equal footing and is the primary gauge of value direction. Where the two diverge, we say so.
How we read value versus list: Because the list price is chosen by the seller or agent, beating it does not prove a home reached its worth. We compare each sale against homes of similar size, lot, age, and location, then measure how far it landed above or below that comparable set. That is the basis for the finding that nearly one in three fast, over-asking sales still closed below comparable value.
Not an appraisal: This is market commentary, not a valuation of any individual property or advice to buy or sell. For your home, ask for a tailored analysis
Author:
Robert Song | Principal Real Estate Advisor
FAQ
Frequently Asked
Questions
Did Danville home prices go up or down in the first half of 2026?
Both can be true, depending on which number you measure. The median sale price rose 1.2 percent, from $2,183,750 to $2,210,000. But price per square foot, the cleaner read on underlying value, fell 4.7 percent, from $825 to $787. That is the real story. The headline held while the value gauge softened. Larger lots and higher-end homes helped support the median, but the per-foot number showed that the broader market gave a little back.
Does selling over the asking price mean I sold over market value?
No. The asking price is a number the seller and agent chose. Beating it proves the number was beatable. It does not prove the home reached its full value. In my first-half Danville review, nearly one in three homes that sold fast and over asking still closed below what comparable homes were achieving. The honest measure is not the list price. It is the comparable set.
Are Danville homes still selling fast in 2026?
Yes, but the market has split. The typical Danville home still sold in about 8 to 10 days and near asking. But the share selling within 14 days fell from 67 percent to 59 percent, while homes sitting 30 days or longer rose from 16 percent to 25 percent. Homes drawing five or more offers also dropped from 10 percent to 6 percent. The right homes still move. Mispriced homes now linger.
Which Danville neighborhoods held their value in 2026?
Westside Danville held its premium best, running roughly $970 to $1,130 per square foot while the rest of Danville eased closer to the high $700s per foot. Blackhawk is the cautionary example. Its median price rose about 15 percent, but price per square foot fell about 8 percent because larger, higher-priced estates changed hands. That is why value has to be read neighborhood by neighborhood, and often home by home, not from one citywide headline.